Have you been directed by your team leader to include CAGR in your PPT slides during presentations such as business reviews or investment result reports?
Here’s a quick guide to calculate it using Excel:D
CAGR (Compound Annual Growth Rate) represents the average annual growth rate over a specified period, assuming growth occurs at a constant rate each year. Essentially, knowing only the initial and final values allows you to determine the average annual growth percentage, making it a highly useful metric.
The CAGR formula is as follows :
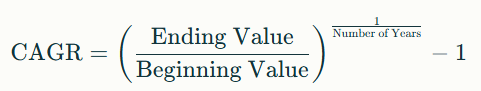
- Initial Value: The value at the starting year
- Final Value: The value at the ending year
- Period (Years): The difference between the ending year and the starting year
Here’s a summary of how to calculate CAGR using Excel formulas or functions. Personally, I often use the last RATE function.
For example, if the revenue in 2019 was 100 billion and 161 billion in 2024, the CAGR over the 5-year (2024 - 2019) period is approximately 10%.
- (Final Value / Initial Value) ^ (1 / Number of Years) -1 * i.e) =(1610/1000)^(1/5)-1
- = POWER(Final Value / Initial Value, 1 / Number of Years) - 1 * i.e) =power(1610/1000, 1/5)-1
- = RRI(Number of Years, Initial Value, Final Value) * i.e) =rri(5, 1000, 1610)
- Concept of Required Rate of Return
- Supported only in Excel 2016 and later versions
- = RATE(Number of Years, 0, - Initial Value, Final Value) * i.e) : = rate(5, 0, -1000, 1610)
Q. Can't we just use the average of yearly growth rates?
Don't Be Fooled by Simple Averages - Why CAGR Matters for Growth Metrics.
While both average yearly growth rate and Compound Annual Growth Rate (CAGR) measure growth rate, they differ significantly in calculation and interpretation. Averaging yearly growth rates simply sums up the individual yearly percentages and divides by the number of years. CAGR, however, calculates the compounded annual growth rate over the entire period.
For instance, three years of growth are 10%, 20%, and 5% (starting with 100, ending at 138.6),
- Average Yearly Growth: (10 + 20 + 5) / 3 = 11.67%.
This seems reasonable, but it doesn't capture the compounding effect.
- CAGR: =RATE(3, 0, -100, 138.6) = 11.5%.
This reflects the actual compounded annual growth achieved.
The difference might seem small, but it amplifies with volatility.
For instance, 100% growth for 2years in a row and 50% decline followed (starting at 100, ending at 200),
- Average Yearly Growth: (100 + 100 - 50) / 3 = 50%. ! This paints a misleading picture.
- CAGR: =RATE(3, 0, -100, 200) = 26%.
This highlights the impact of compounding – the growth wasn't consistently 50% annually.
Whether crafting a business plan, investor presentation, or any strategic document, ditch the simple average and embrace CAGR for accurate and insightful growth representation. It's the key to understanding the true power of compounding and making informed decisions. Go ahead and enjoy that well-deserved after-work time!
'Office Tip' 카테고리의 다른 글
| [엑셀] CAGR 연평균성장률 계산 수식 함수 (2) | 2025.06.28 |
|---|